Here’s a look at some of the stuff I did for that Demography assignment:
One year of high school or more by age and race/ethnicity
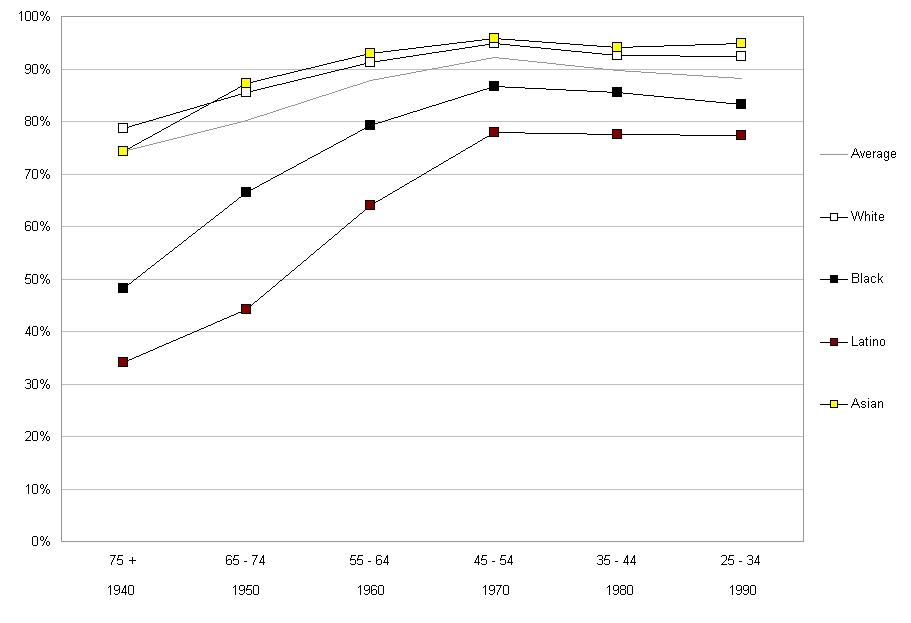
Universe: Native born Californians 25 years old and over.
Source: US Census 2000.
This graph shows the percentage of persons by race/ethnicity and age group who have completed at least one year of high school. The x-axis shows age groups from oldest to youngest. Below each age group is the year that those persons would have been in their high school/college years (e.g., the 65 to 74 group would have been 15 to 24 in 1950).
All groups show improvement from 1940 to 1970, with Latinos showing the most rapid improvement. All groups also seem to hit a plateau between 1970 and 1990.
Since this graph relies on Census 2000 data exclusively, there is no way to tell if there has been any improvement within age groups between Census administrations. However, the assumption is that educational attainment is usually a static characteristic for most people once they hit 25.
One year of post-secondary education or more by age and race/ethnicity
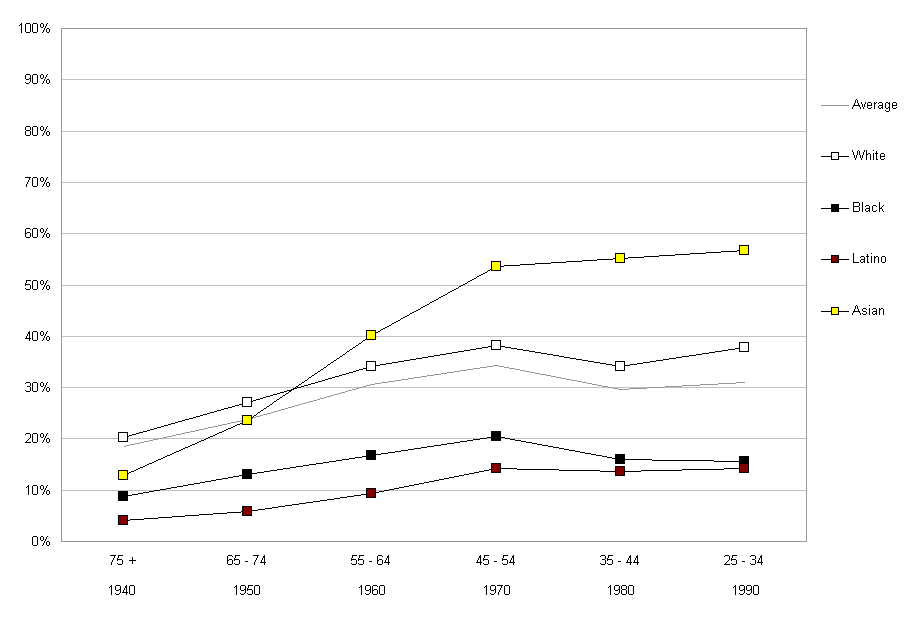
Universe: Native born Californians 25 years old and over.
Source: US Census 2000.
This graph shows the percentage of persons by race/ethnicity and age group who have completed at least one year of post-secondary school (e.g., community college, college, technical school).
Once again, all groups show improvement from 1940 to 1970, but this time Asians show the most rapid improvement. The rate of change from 1970 to 1990 is different for different groups: slight increase for Asians, virtually no change for Whites and Latinos, and a slight decrease for Blacks.
Interpretation
As far as the first year of high school is concerned, it appears that Blacks and Latinos have significantly closed the gap over the years. However, their progress has stalled. Also, since the dataset I worked with did not differentiate between the first year of high school and a high school diploma, it is difficult to tell how much the numbers reflect graduation rates. However, the broad trends we can see are important.
The numbers and trends for post-secondary education are worrisome. Much wider gaps remain among the different racial/ethnic groups, and there doesn’t appear to be any positive trends for those groups that are “behind.” If the only way to earn a decent living requires a college or some other post-secondary degree (or mad poker skillz), then a significant proportion of the population, particularly Blacks and Latinos, is going to face a struggle.
Extrapolating to 2030
The California Department of Finance has a population forecast that covers 2000 to 2050. Using this as a base, educational attainment rates were applied to the corresponding age groups. For example, if 20% of Blacks 45 to 54 had one or more years of post-secondary education in 2000, it was assumed that this rate had not changed in 2030 when this group was now the 75 to 84 group.
Groups that were not covered in the 2000 data (e.g., 25 to 34 year olds in 2030 would be 0 to 4 years old in 2000) were given the rates that the trends tended to show. Since most of the trends showed little movement for all groups post 1970, the 25 to 34 attainment rates were applied to all new groups.
Here’s how the makeup of the state changes in terms of population and educational attainment:
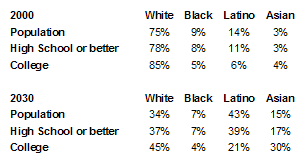
The percentages are, in order:
Share of population.
Share of population with one or more years of high school.
Share of population with one or more years of post-secondary education.
As you can see, Latinos become the new plurality population by 2030, but remain in third place in terms of their share of the “college educated” population. Asians remain in third place in terms of population numbers, but represent a disproportionate share of the “college educated” population. Greater college pot equity, if you will. Does this mean that Miller would advocate that Asians push for more funding to go to colleges and universities since they will benefit most?
More seriously, though, I think that if this forecast is in any way accurate, it is not a good thing for the state. Please note that I have no clue why the attainment levels are the way they are. It’s probably a number of different things working together, and I don’t know what the fastest and most cost-effective solutions to change the situation are. But if current trends continue in the way that they are going, we’ll have a big imbalance in attainment, and presumably well-being and financial success. Given the problems with riots and things that we’ve faced in the past, as well as our sense of fairness and equality, we should move now to head off future problems.
I don’t know why I’m so amused that you used white dots for white people, maroon for hispanic, black for black, and yellow for asian, but I am.
By the way, thanks for the coffee. In the interest of keeping it fresh, I haven’t cracked it open yet. I still have some of my other beans left, but I’ll give you a proper thanks when I do open up the beans and give them a shot.
Thanks again!
Heh.
Well it’s good to use different colors for different groups, and using colors other than black and white for Black and White can make your visual presentation a little confusing. From there, brown and yellow are natural extensions of that scheme (Excel said it was brown–but I agree it’s more of a maroon). At least this way you don’t have to refer to the legend to figure out who is who…
If I were comparing age groups across time (e.g., homeownership of 25-34 year olds in 1980, 35-44 year olds in 1990, 45-54 year old in 2000), I’d use shades of black, white, and shades of gray.
As for the coffee, I hope you enjoy it. I just had my third cup of the stuff for today and am feeling a bit wired.